
Task management software is a blessing, but managing teams on it is a full-time job. Sometimes the processes are sorted and assigned, but tracking and reporting are haphazardly done. Is your team using ClickUp but still struggling with visibility and reporting? Do dashboards feel cluttered or confusing? You may have tried setting up ClickUp reports, but you can’t get the right data in one place. The worst part in this situation is that your weekly updates still involve copy-pasting into emails.
ClickUp is a powerful task management tool, but only when it’s configured the right way. And if you’re not using ClickUp dashboards and reporting tools to their full potential, you’re missing out on major time savings and insights.
As a technical project manager, I help businesses build clean, effective, and automated dashboards in ClickUp. The Goals? Teams stay focused, clients stay informed, and projects move faster.
truggling with Reporting in ClickUp?
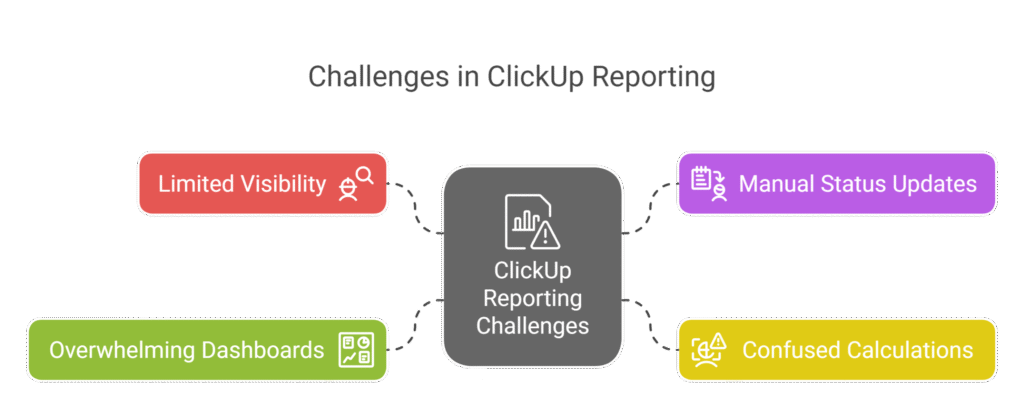
ClickUp reporting and dashboard creationis not complex, but it is not everyone’s cup of tea. You might have experienced one of the following challenges, and if you nod yes to any of these, then it is the right time to take the right action:
Limited Visibility into Project Progress: You’re managing tasks in ClickUp, but where’s the big picture? Without custom dashboards, tracking milestones, workloads, or deadlines becomes guesswork.
Manual Status Updates: Still writing progress emails every week? Not sure how to email the ClickUp status report updates automatically? That’s a sign your reporting isn’t working for you.
Confused About ClickUp’s Calculations: Wondering how to use the calculation feature in ClickUp dashboards for things like budget tracking or team capacity? It’s powerful, but only if it’s set up right.
Overwhelming or Empty Dashboards: You created a dashboard, now what? Without the right structure, ClickUp dashboards either show too much or nothing at all.
Imagine Crystal-Clear & Descriptive ClickUp Reporting
Here’s what happens when your ClickUp workspace is optimized for reporting:
Instant Insights: Custom widgets show you exactly what matters—no digging required. Whether it’s task completion, team capacity, or sprint burndown, your key metrics are front and center.
Automated Status Emails: Weekly updates go out automatically. No more compiling reports manually. Stakeholders stay in the loop, and you get your time back.
Real-Time Calculations: Use ClickUp’s formula and calculation widgets to track budget, hours spent, and task trends. Reporting becomes dynamic and data-driven.
Fully Custom Dashboards: From sprints to resource allocation, you can create a dashboard in ClickUp that serves each team or department, without overwhelming them.
This isn’t a wishlist. It’s what happens when dashboards are aligned with your real project needs.
My Approach to ClickUp Reporting and Dashboards
After helping multiple teams streamline their ClickUp project management setup, I’ve developed a clear process that helps teams go from “we don’t know what’s happening” to “we know what’s next.”
Here’s how I make ClickUp work for you:
1. Discovery and Audit
We start by understanding:
What do you need to track: projects, teams, and metrics?
What reporting do clients or executives expect?
Are your current dashboards helping or hurting?
We’ll review your existing ClickUp structure and spot the gaps.
2. Dashboard Strategy & Design
Next, I build out a custom dashboard layout tailored to your team’s needs. This includes:
Widget selection & layout
Folder and list filtering
Team-specific views
Color-coded task statuses
ClickUp report types (time tracking, task status, goals, etc.)
Whether it’s a manager overview or a dev sprint board, we’ll make it visual, simple, and useful.
3. Automations and Emails
We’ll set up:
Automated status updates via email
Weekly summaries sent to stakeholders
Report widgets that update in real time
No more “just checking in” messages; your dashboards will do the talking.
4. Training & Optimization
Finally, I provide hands-on support:
Show your team how to create reports in ClickUp
Walk through how to create a dashboard in ClickUp from scratch.
Teach your PMs how to use calculation widgets and goal tracking.
Keep dashboards lean, clean, and scalable as your team grows.
What Makes Me Good At ClickUp Dashboards and Reporting?
Here’s what sets this service apart:
ClickUp Certified Expertise: I know what features work and how to apply them for real-world results.
Tech + Strategy Combo: You’re not just getting a setup. You’re getting smarter execution and fewer reporting headaches.
Client & Team-Friendly: Dashboards that are easy to read, easy to update, and loved by clients and teams alike.
Hands-On Support: I guide you through every step, and I will be available to tweak as your needs evolve.
Results You Can Expect
Real-Time Dashboards: Stop waiting for updates because you can see your data live.
Faster Status Reporting: Save hours every week with automated emails and reports.
Clear Team Accountability: Everyone knows what’s expected and what’s next.
Scalable Insights: As your business grows, your dashboards scale with you.
Do You Want Self-Explanatory ClickUp Reports & Interactive Dashboards?
You should stop looking at ClickUp as just a task management software, because its dashboard and reporting features are amazing for a bird’s eye view of every task and project in process. The only thing it demands is a perfect configuration that aligns with your goals and interests.
Let us convert your messy progress boards into an interactive and engaging dashboard for your team’s and clients’ satisfaction, because they deserve it!
Let The ClickUp Reports Talk More Than You!
Frequently Asked Questions
ClickUp is a cloud-based task management software that lets teams manage tasks, track goals, automate workflows, and create visual dashboards.
You can create a dashboard by navigating to the "Dashboards" tab, clicking “+ Add Dashboard,” and choosing from a variety of widgets like task tracking, time estimates, or workload views. I help you choose the right structure for your needs.
ClickUp reports are created through widgets on dashboards, including charts, tables, and calculations based on filters like assignee, status, or due date. I tailor reports that speak directly to your team or client's needs.
You can automate report emails using ClickUp’s built-in email options or via integrations like Zapier. I set these up so your team and stakeholders receive timely updates without lifting a finger.
ClickUp’s calculation widgets allow you to sum up time, costs, or progress across tasks. I will show you how to apply them correctly to things like sprint velocity or budget tracking.